How to interpret the feedback indices and maps
We have constructed 12 maps of rainfall feedback patterns for the 17 states in the Western USA using the time-series analysis described by Soubeyrand, Morris and Bigg (2014) with daily rainfall data from the US National Centers of Environmental Information. We accessed daily rainfall data from the Global Historical Climate Network data base for sites with ca. 100 years of data. There were 1250 such sites.
Rainfall feedback indices were calculated for each site for 12 different configurations of the data representing three different "seasons" of the year and four historical series.
Seasonal periods
- January to December (whole year)
- April to September (spring and summer only)
- October to March (fall and winter only)
Historical series
- the entire 100-year period
- up until 1960
- after 1960
- the difference in post-1960 vs. pre-1960 indices thereby reflecting changes in trends.
There are 4 main components of the maps:
1- Pins that show the value of the index at each site,
2- Drop-down menus for each pin with a set of information about the site,
3- Contour lines delimiting regions that have similar values of the indices,
4- A legend that indicates the color codes for the indices and the contours on the map.
Pins and indices
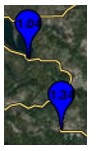
Each pin represents a site where daily rainfall data were available for a series of about 100 years and contained a sufficient number of "key days" to calculate the feedback indices (see below for an explanation of "key days"). The value in the pin is the index called FeedbackStat as described below. The color of the pin is coded according to a gradient from blue to red indicated in the legend. Blue indicates positive values of the index and red indicates negative values of the index. In general, positive values for feedback indices mean that there were more rain events in the 20 days following a key day compared to average rainfall patterns for that site. Likewise, a negative value for the index means that there were fewer rain events in the 20 days following a key day compared to average trends. In the section on Drop-down menus there are more details about interpreting the indices and, in particular, how to interpret FeedbackStat.
The maps for the entire 100-year period for January to December have pins for all 1250 sites. For the other maps, representing subsets of the data, there can be fewer pins because at some sites there were not a sufficient number of key days in the series to allow us to calculate the indices.
Drop-down menus for each pin
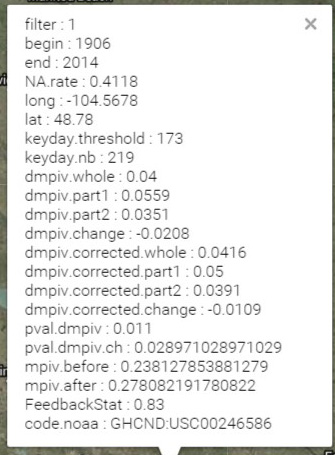
Each pin is also associated with a series of other statistics and information about the site that will drop down if you touch the pin with the cursor. All of the statistics and identification information about the sites are available in an Excel file that you can download from the Data page of this website.
The most important variables for understanding the maps are:
- Filter: Data filter = 1 (Jan-Dec), 2 (April-Sept), 3 (Oct-March).
- Begin / End: The range of years covered by the data set for this site.
- NA.rate: The rate of missing rainfall values over the whole range of years covered by the data for this site.
- Long / Lat: Longitude and Latitude location of the site in decimal degrees.
- Keyday.threshold: The minimum amount of rain (in tenths of mm) for a rainfall event to be considered as a key day. In theory, this amount corresponds to a quantity of rain needed to set off processes involved in rainfall feedback (such as propagation and/or flux of ice nucleation-active particles into the atmosphere). But for technical reasons related to the constraints of the time series analysis calculations, this threshold is set with regard to statistical considerations.
- Keyday.nb: The number of key days for this site. The feedback indices were calculated for the days spanning from 20 days before to 20 days after a key day. The number of key days was optimized so that there were 4 key days per year for each year having a complete data set. This constraint impacts the value of the Keyday.threshold.
- dmpiv.whole: Value of the dmpiv feedback index. This index is the same as D as described in Soubeyrand et al (2014, equation 2) and CD in Bigg et al (2015, equation 1) calculated based on rain occurrence. Heuristically, it can be interpreted as the number of supplemental rain events per day in the 20 days after a key day rain event compared to the average number of per-day rain events for the site. This index was calculated for the entire historical period and the season corresponding to the filter indicated on the map.
- dmpiv.part1: Value of the dmpiv index for the historical series from the beginning date until the end of 1960 for the season corresponding to the filter indicated on the map.
- dmpiv.part2: Value of the dmpiv index for the historical series from 1961 until the end date for the season corresponding to the filter indicated on the map.
- dmpiv.change: Value of dmpiv.part2 - dmpiv.part1
- dmpiv.corrected.whole: Value of the corrected dmpiv feedback index. This index is based on the dmpiv index, corrected for possible seasonal asymmetry. Motivation: if key days tend to occur at the very beginning (or end) of rainy seasons, then the number of rain occurrences after the key days will tend to be larger (or lower) than before the key days, and the dmpiv index will tend to be positive (or negative). Correction: the corrected dmpiv index will be given in Morris et al (manuscript in preparation). In this index, one takes into account the seasonal asymmetry as follows: for a key day corresponding to the n-th day of the year, one substracts (i) the after-before difference of rain frequency computed for that particular key day and (ii) the after-before difference of rain frequency averaged for all the n-th days of all years with available data.
- dmpiv.corrected.part1: Value of the corrected dmpiv index for the historical series from the beginning date until the end of 1960 for the season corresponding to the filter indicated on the map.
- dmpiv.corrected.part2: Value of the corrected dmpiv index for the historical series from 1961 until the end date for the season corresponding to the filter indicated on the map.
- dmpiv.corrected.change: Value of dmpiv.corrected.part2 - dmpiv.corrected.part1
- pval.dmpiv: P-value indicating whether dmpiv.whole is significantly different from zero (see Soubeyrand et al; 2014).
- pval.dmpiv.ch: P-value indicating whether dmpiv.change is significantly different from zero (see Soubeyrand et al; 2014).
- mpiv.before: rate of days with rain in the 20 days before a key day (average number of per-day rain events).
- mpiv.after: rate of days with rain in the 20 days after a key day (average number of per-day rain events).
- FeedbackStat: Value of the pertinent dmpiv index (dmpiv.corrected.whole, dmpiv.corrected.part1, dmpiv.corrected.part2 or dmpiv.corrected.change, depending on the map) X 20. By multiplying the dmpiv index by 20, we obtain an estimate of the average number of supplemental rain events in the 20-day period that follows a key day for the period of data represented by the map. For maps representing changes after 1960 compared to before 1960, FeedbackStat indicates the supplemental number of rain events in the 20-day period after 1960 compared to before 1960.
- Code.noaa: The identification code attributed to the site on the Global Historical Climate Network data base
Contour lines of regions with similar values for the indices
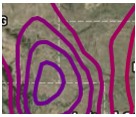
Zones with similar values of the FeedbackStat index have been delimited. The colors of the lines correspond to the average value of the index for the regions and are based on the same color scale used for the indices. The contours represent isolines from kriging predictions as described in Soubeyrand et al (2014)
Legend
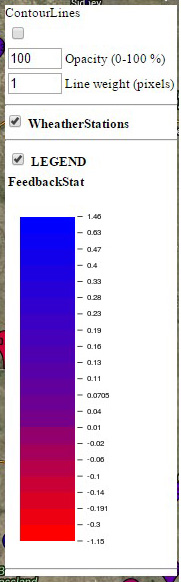
The legend indicates the range of values of FeedbackStat and the corresponding color of the pin and contour lines. By clicking on the boxes for WeatherStation, for ContourLines and for Legend, you can control the display of these parameters on the map.
Bigg E.K., Soubeyrand S., Morris C.E. 2015. Persistent after-effects of heavy rain on concentrations of ice nuclei and rainfall suggest a biological cause. Atmos. Chem. Phys. 15: 2313-2326.
Soubeyrand S., Morris C.E., Bigg E. K. 2014. Analysis of fragmented time directionality in time series to elucidate feedbacks in climate data. Environmental Modeling and Software 61:78-86