Maps of rainfall feedback:
a tool to explore rainfall patterns on a regional scale
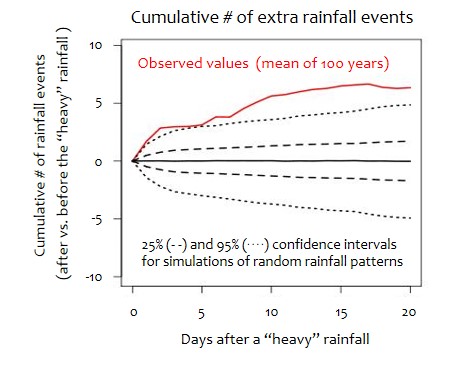
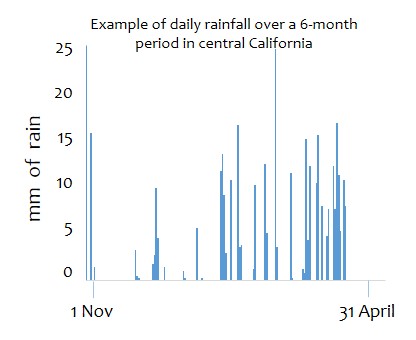
Over the short-term and at local scales, the occurrence of rainfall does not seem - at first glance - to have distinctive patterns that can be described or predicted. Nevertheless, patterns at these scales also have consequences for society, and most critically on agriculture. Efforts to describe patterns in series of rainfall events have recently revealed that rainfall on one day can be significantly correlated with the probability of rainfall on subsequent days (1). This seeming influence of rainfall on itself - called feedback - can persist for up to 20 days (2). When a rainfall event is followed by a higher frequency of rain events than would be expected on average, this is referred to as positive feedback. Likewise, negative feedback refers to a decrease in rain events following a given rainfall.

The physical and biological phenomena that contribute to rainfall make feedback very plausible (3). Soil moisture and vegetation can contribute to positive feedback of rainfall due to their contribution to atmospheric water vapor and to the aerosol particles needed to set off processes that allow raindrops to form and fall. Biological ice nucleators, including ice nucleation-active bacteria that can be emitted from plants, are among the most frequently evoked potential contributors to rainfall feedback. Atmospheric dust generated under dry conditions can lead to negative feedbacks of rainfall because they can inhibit the formation of raindrops (4). Many of the factors that could promote positive rainfall feedback or that could exacerbate negative rainfall feedback are anthropogenic, i.e., they are related to human activities. While atmospheric circulation is the main determining factor in rainfall, understanding the processes that underlie rainfall feedbacks gives promise for new ideas to mitigate drought or to avoid exacerbating drought on a regional scale.
To elucidate the mechanisms of feedback, we need to
locate regions where feedback occurs or where it has occurred in the past but has
been attenuated. Using the method that we developed to identify patterns in daily rainfall, we have caluclated indices of rainfall feedback
based on historical daily rainfall data.
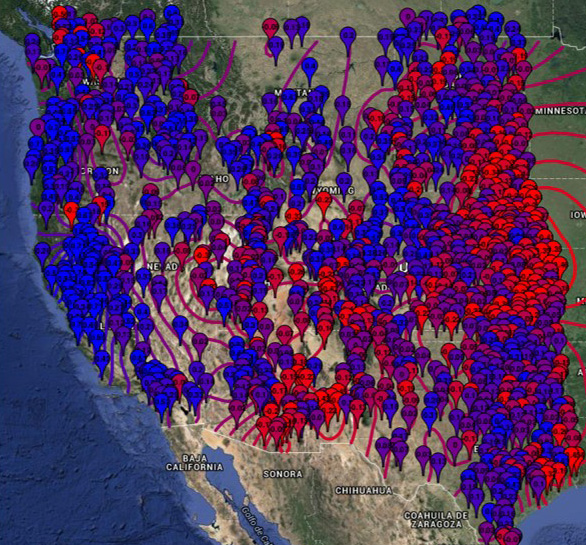
We have created maps of these indices for almost 3000 sites in the USA by exploiting freely-available
meteorological data.
This website houses
- - maps of indices of the intensity of rainfall feedback across the western USA,
- - information about how to interpret the maps,
- - suggestions about using them to investigate the mechanisms that cause feedback,
- - links to resources to allow you to make maps of other geographic locations.
Use the links on the top of the page to navigate to the pages containing the maps and the accompanying information.
For more information:
(1) Soubeyrand S., Morris C.E., Bigg E.K. 2014. Analysis of fragmented time directionality in time series to elucidate feedbacks in climate data. Environmental Modeling and Software 61:78-86
(2) Bigg E.K., Soubeyrand S., Morris C.E. 2015. Persistent after-effects of heavy rain on concentrations of ice nuclei and rainfall suggest a biological cause. Atmos. Chem. Phys. 15: 2313-2326.
(3) Morris C.E., Conen F., Huffman A.J, Phillips V., Poeschl U., Sands, D.C. 2014. Bioprecipitation: a feedback cycle linking Earth history, ecosystem dynamics and land use through biological ice nucleators in the atmosphere, Global Change Biology, 20, 341-351, doi: 10.1111/gcb.12447
(4) Rosenfeld D., Rudich Y., Lahav R. 2001. Desert dust suppressing precipitation: A possible desertification feedback loop. PNAS 98(11), 5975-5980. Doi: 10.1073/pnas.101122798
(5) Morris C.E., Soubeyrand S., Bigg E.K., Creamean J.M., Sands D.C. 2016. Mapping rainfall feedback to reveal the potential sensitivity of precipitation to biological aerosols. BAMS. Doi: 10.1175/BAMS-D-15-00293.1