ColevalTraining
Instruction manual for training tools using the ColEval method.
A) Principle of the method
The ColEval method is based on the evaluation of the surfaces, in percentage, of a complete frame face (=100%). These surfaces are occupied by the different components that describe the structure of the colony:
the area covered by bees,
the area occupied by the capped brood cells,
the area occupied by the open brood cells,
the area occupied by the reserves (honey, nectar),
the area occupied by the pollen.
For bees and brood cells, these surface percentages are then transformed into numbers (see the method presentation document)
B) Training from virtual images
Virtual images have therefore been created to train the future ColEval user.
In practice, the quality of the descriptor using ColEval depends on its visual ability to estimate as accurately as possible the percentage of a given category.
This is why we have created this tool, the principle of which is to exercise the eye and the brain to assign the percentage of surface area occupied, on an image, by a color dispersed into several spots.
Future developments of the application may provide access to more complex images where the degree of task fragmentation is higher, as sometimes found in mosaic brood frames.
- The images.
These images are made up of spots of 4 different colors, one of which (dark red) is the background and is not evaluated.
The other three colours (dark blue, light blue and yellow) are divided into several discontinuous spots.
Each image is made up of a set of spots; each color occupies a given proportion of the surface area of the virtual frame. These proportions are drawn at random. Each image is unique.
A bank of 5000 images has been created and is not limited.
- The sequence of an exercise.
An exercise mimics the description of a colony, i.e. 20 images to represent the 20 faces of frames.
When you connect, an image appears: its address ends with…… /ColEval/cadre1.php.
Below the image, you must fill in all three evaluations, one per color; then move on to the next one. You can also consult the solutions.
- Once the 20th image has been evaluated:
• you can request the Results, which is displayed on a new page as 3 graphs showing the relationship between the real results and your estimates, for each color; above its figures, the value of the average error made on the 20 images is calculated.
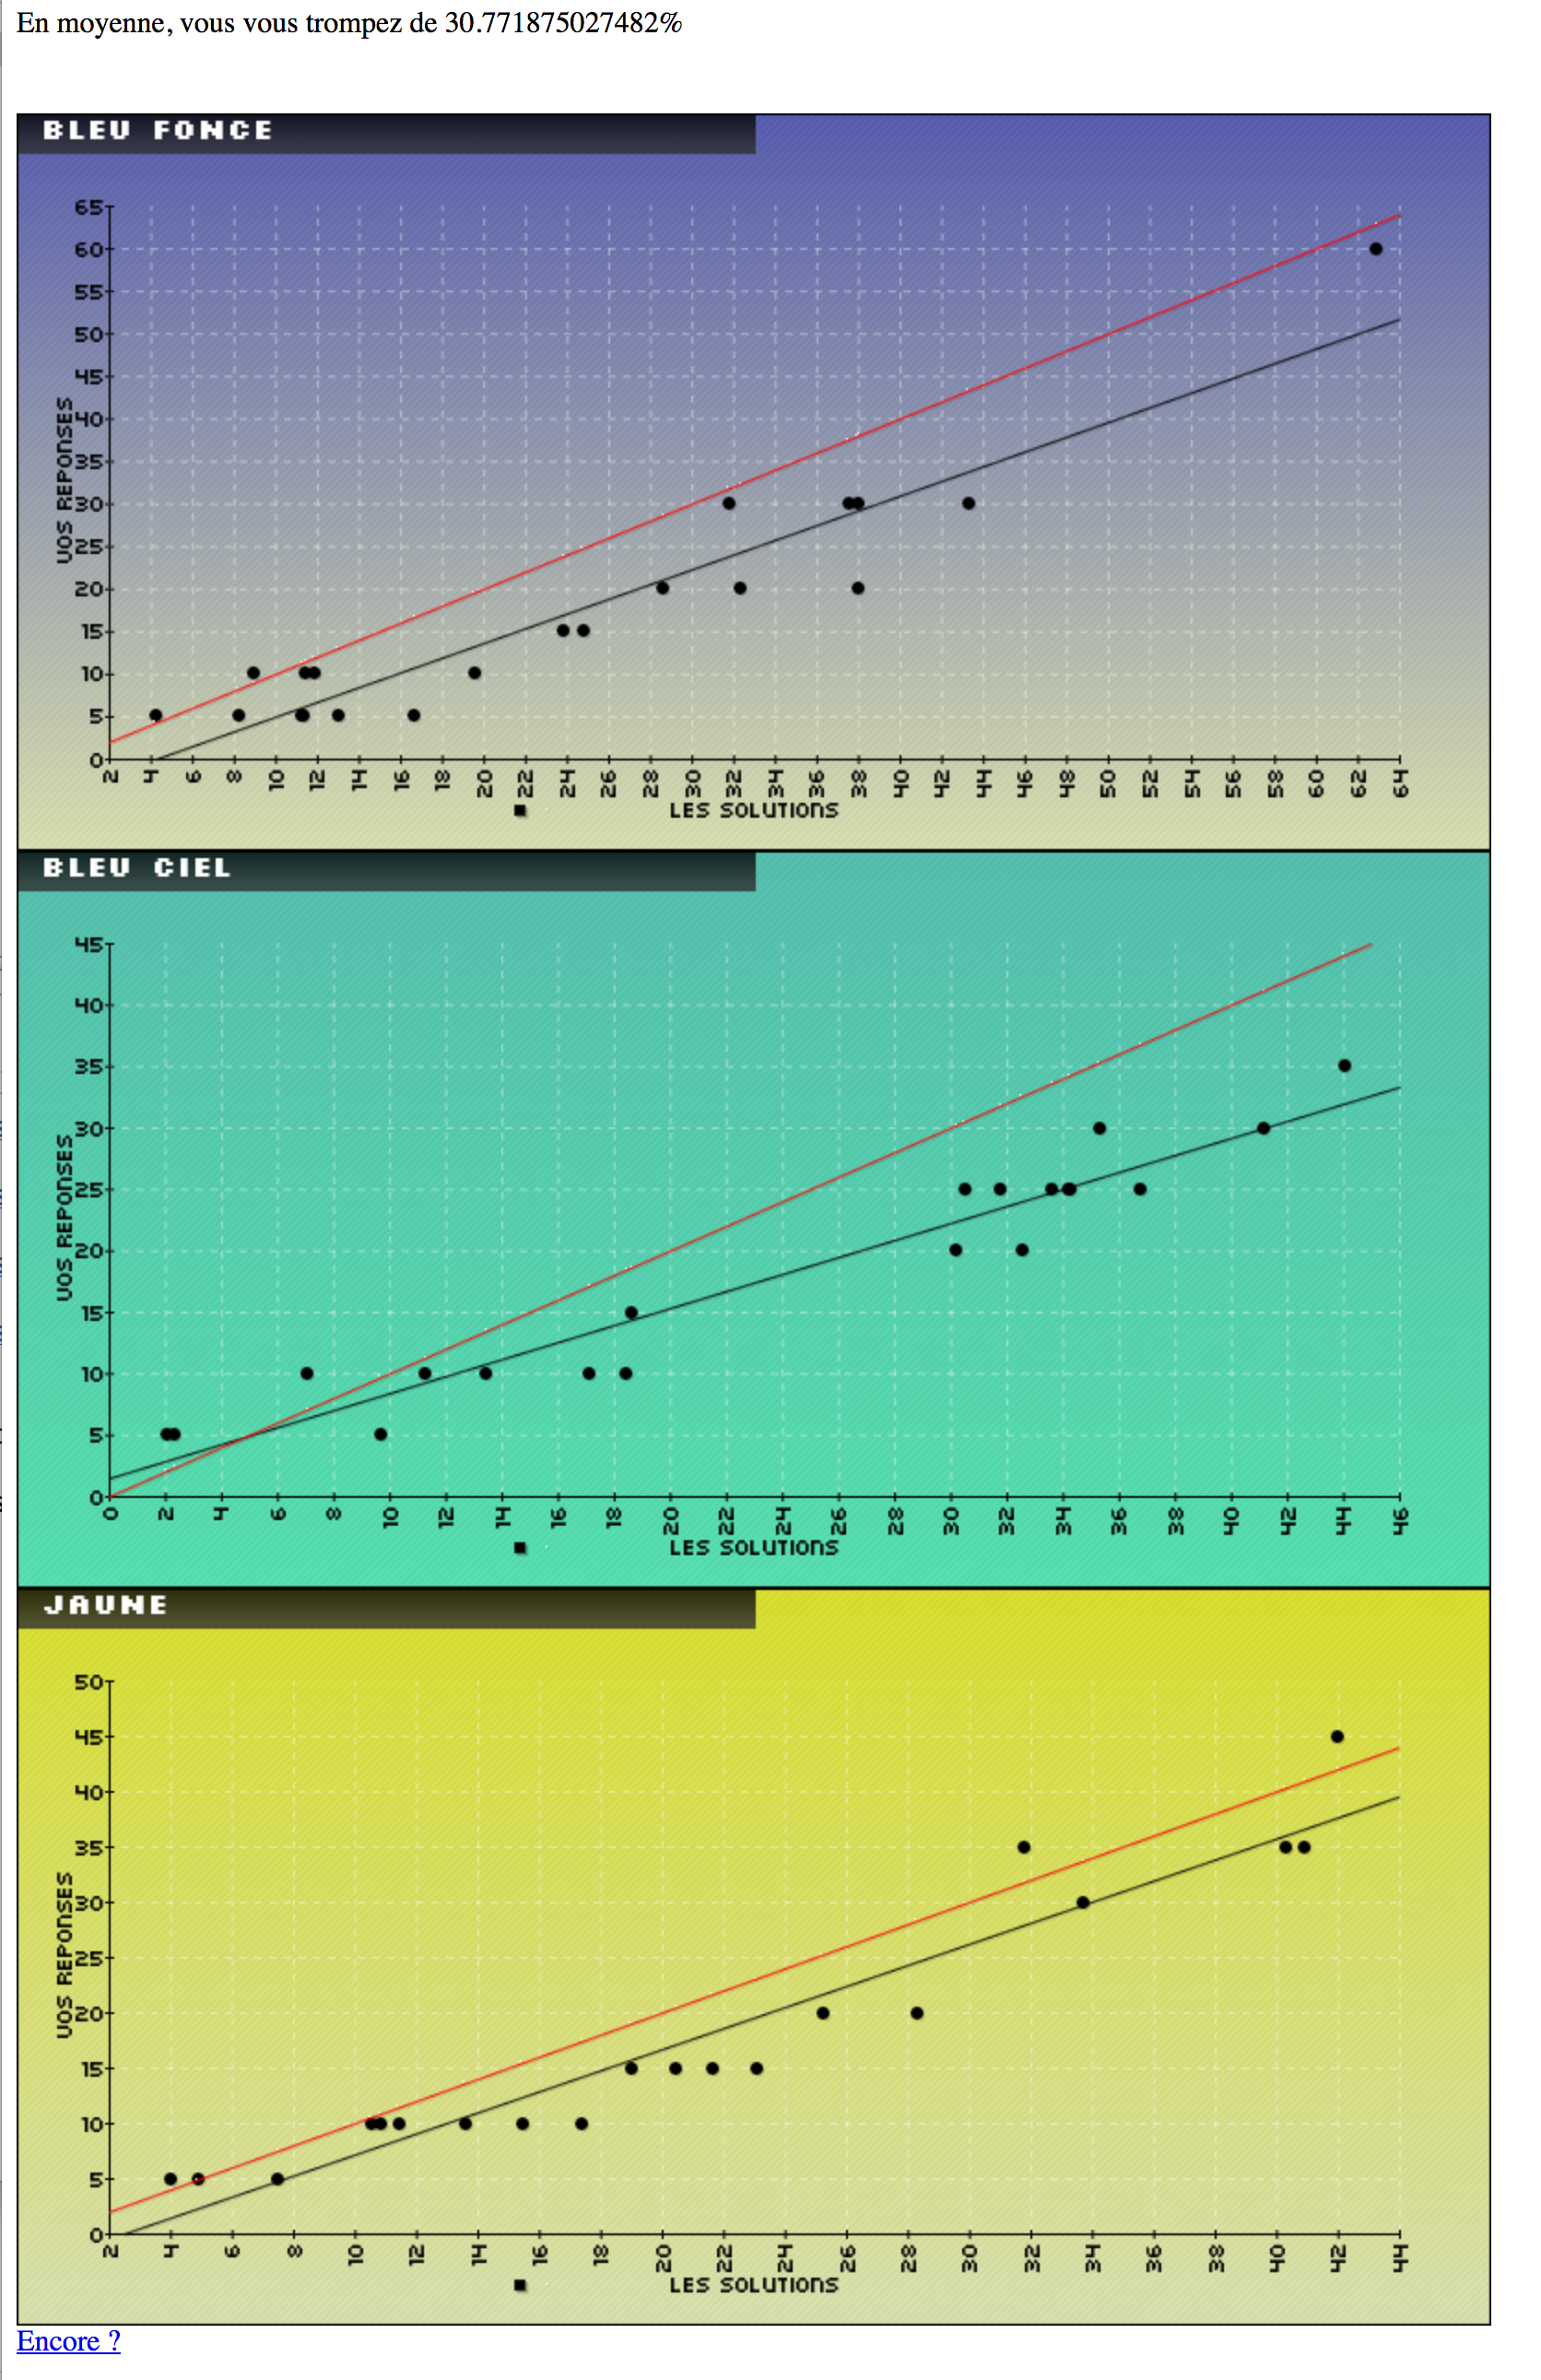
example of results
• you can enter an email address to receive a table of your evaluations and exact results.
You will receive a “Summary of your test” letter with an attached file named:" aaaa-mm-mm-j-d-d-hh-mm-ssColEval.csv“. From its files, you can evaluate the evolution of your error.
C) Training from pictures of frames (Dadant or Langstroth) to determine the percentage coverage of bees or capped brood.
The principle of the exercise is the same but, here, you only have to give a photo answer. The reference values for brood were determined by manual counting on the photos. The reference values for estimating the percentage of bees were obtained, for each photo, by averaging the estimate of that photo by 20 experienced users. The image bank for broods contains about 400 images per frame type; the one for bees contains 150 images per frame type.
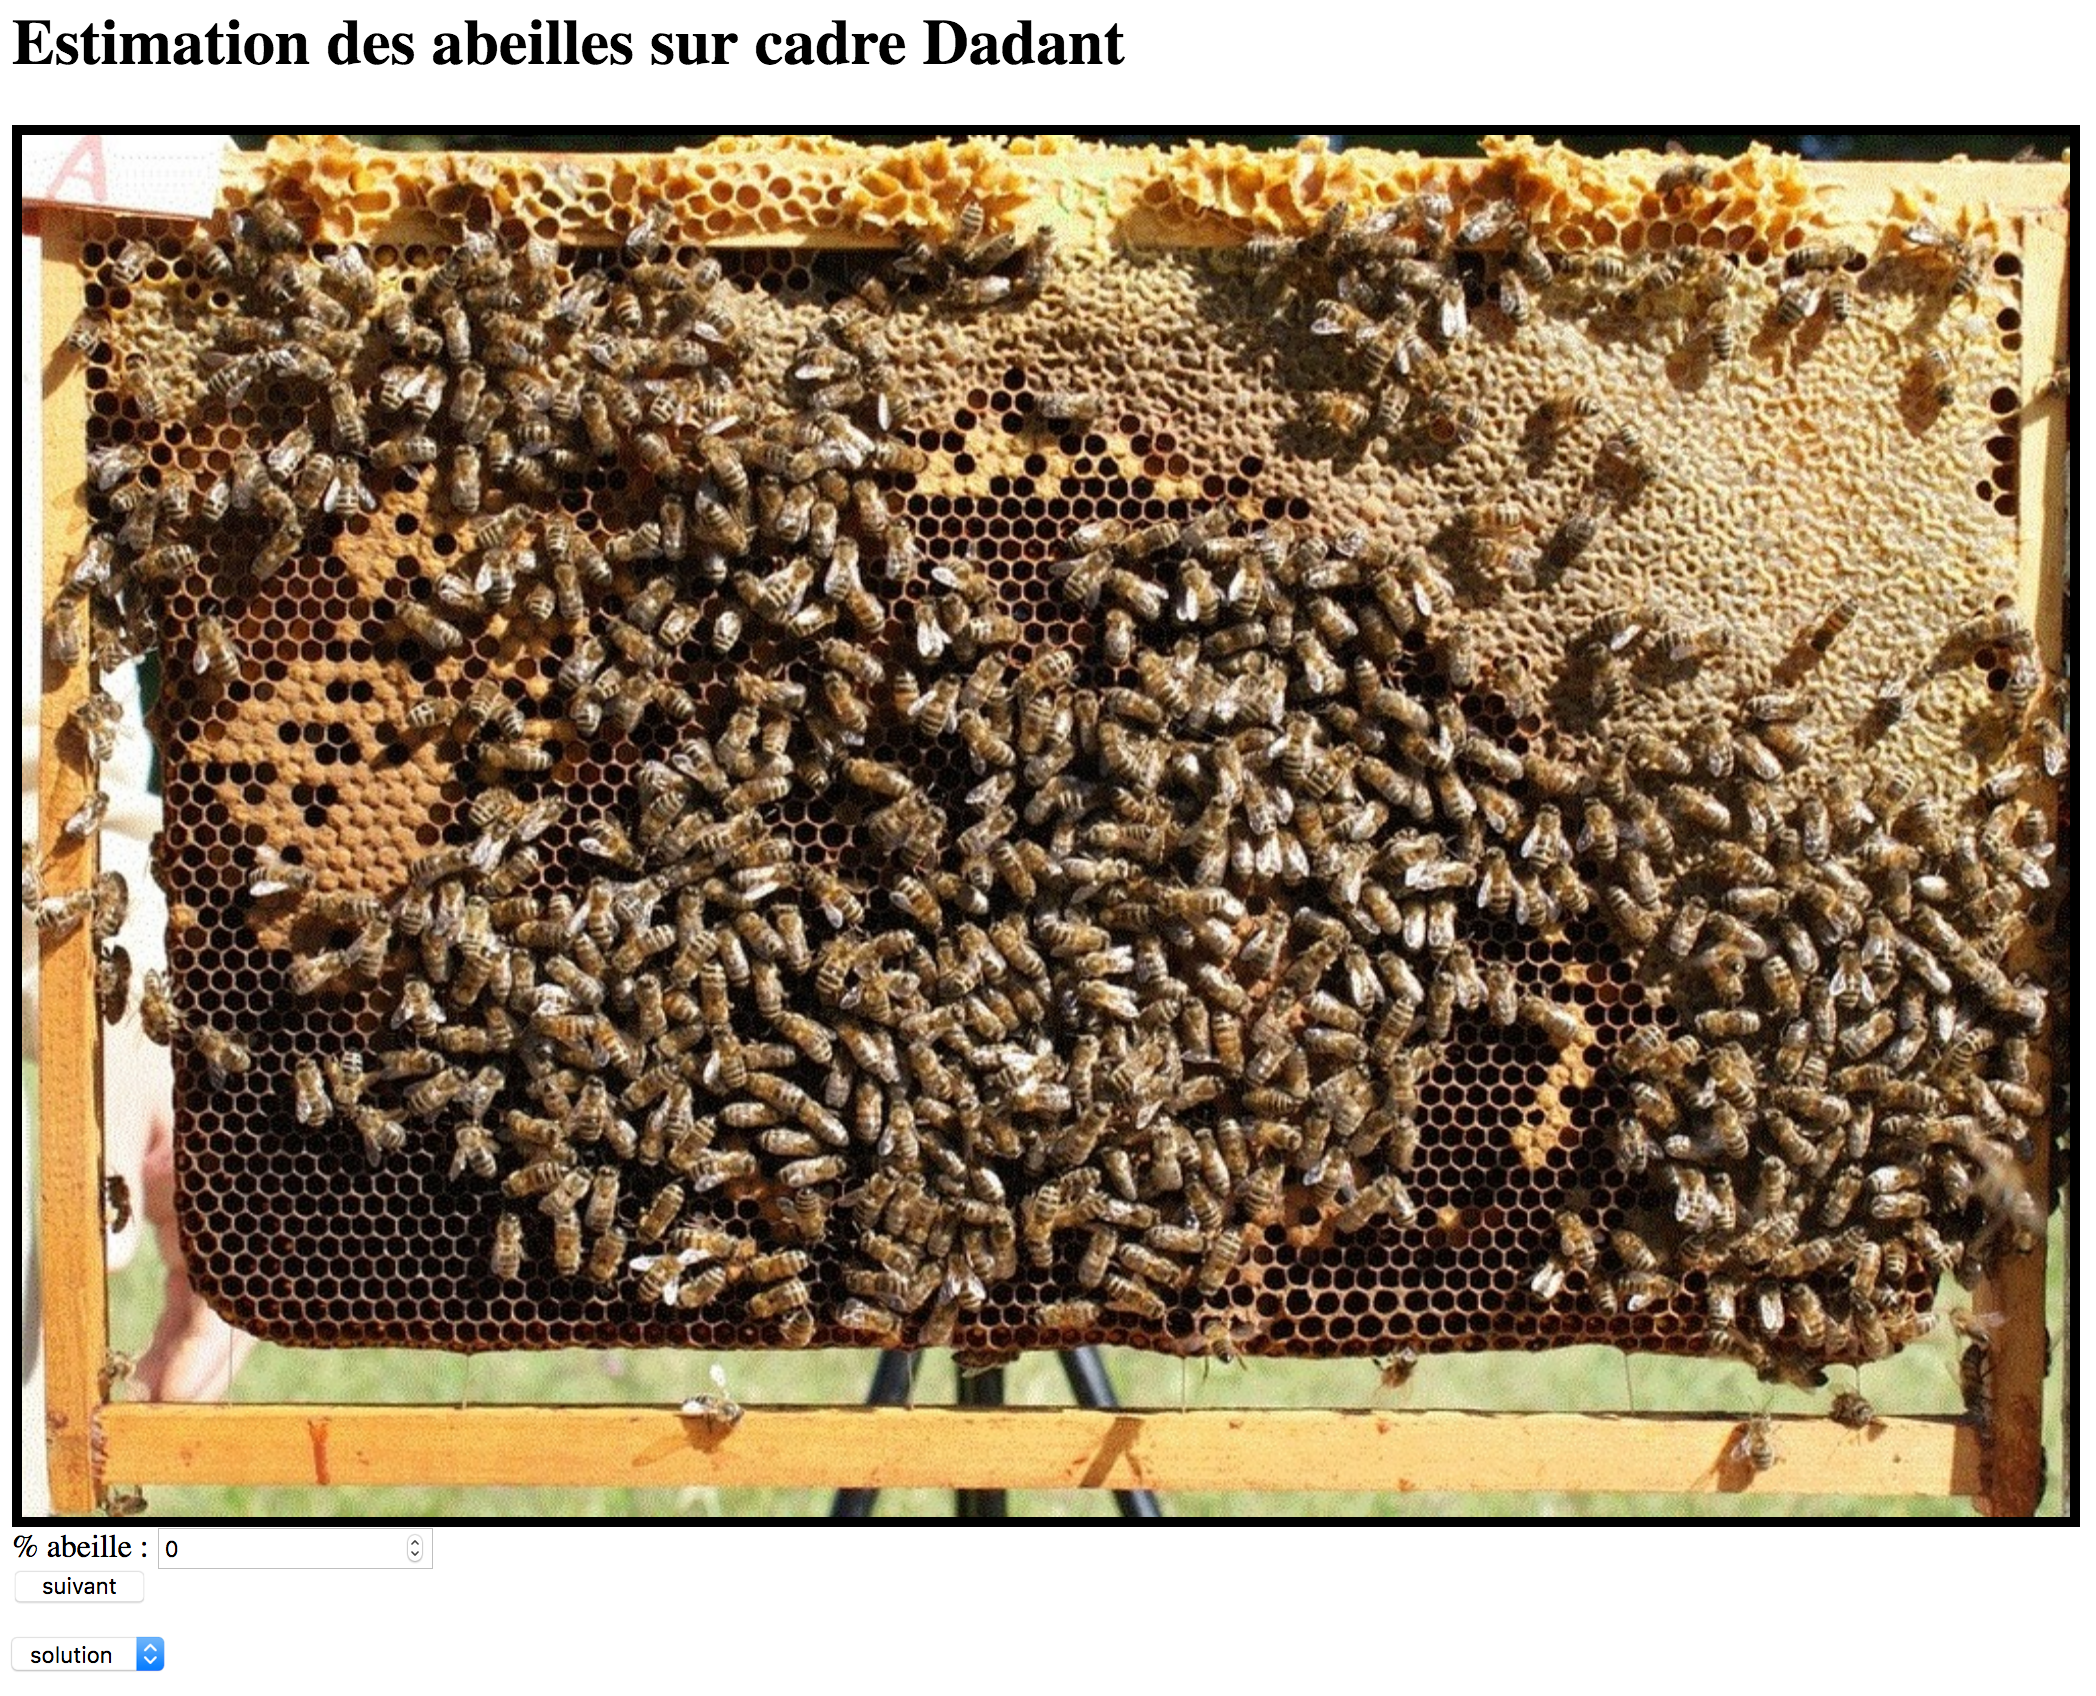
sample bee photos
At the end of the exercise, when you have estimated 20 photos, a graph summarizes the average error and the correction coefficient specific to each type of estimate (Dadant or Langstroth, bees or brood). You can also receive your results by email (.csv file).
Four exercises are available
• Estimation exercise on bee photos (Dadant frame)
• Estimation exercise on brood pictures (Dadant frame)